

Gaslighting Employment
Gaslighting Employment
Today's jobs reports were a tale of two very different economies. What's really going on here?

This morning’s employment reports - the Establishment Survey and the lesser-known Household Survey - delivered mixed messages on the order of an open bar at an AA meeting.
The Establishment Survey saw a massive gain of 272k in employment versus expectations for just 180k, with a negligible downward 15k revision to the prior months. Only 25% of the gains can be attributed to the mathematical wizardry of the Birth-Death model, so there is some real conviction here. Overall, this report found employment is up 1.8% year over year.
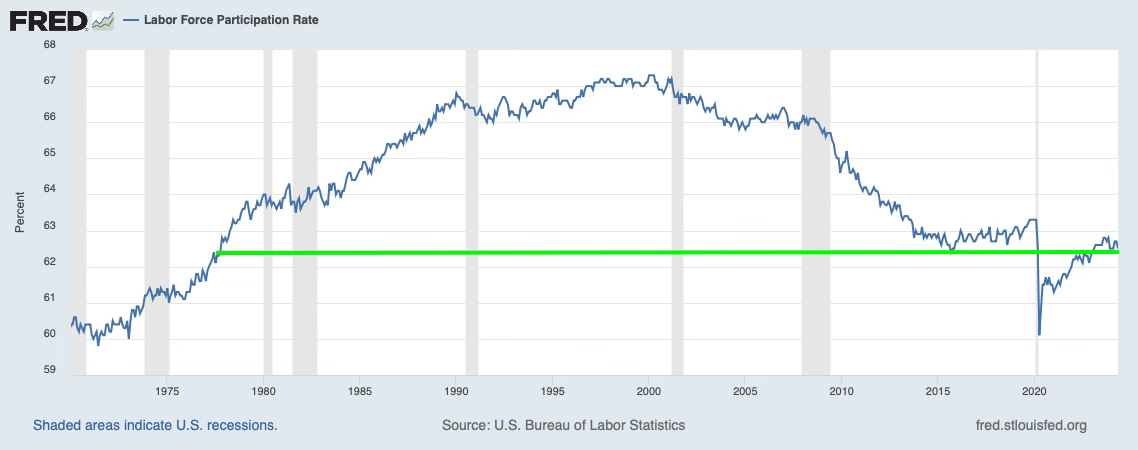
On the other end of the spectrum, the Household Survey saw a loss of 408k jobs and 250k people leaving the labor force. The participation rate remains well below pre-Covid levels and brutally below the 2000 high.
Which do you believe?
The Fed will follow the Establishment Survey, so the July rate cut is basically off the table, but what’s really going on here?
When I see conflicting data like this, I look for supporting evidence.
In favor of the headline Establishment Survey’s hot labor market narrative:
Average hourly earnings rose more than the expected 0.3% at 0.4% MoM and were broad-based. This leaves the YoY trend at 4.1% from 4.0% in April, which will be a major focal point for the Fed.
Some argue that this one better captures the impact of surging immigration.
In favor of the Household Survey’s warning signs:
The JOLTS report and the Challenger Survey indicate a meaningful decline in hiring plans, in line with the Household Survey. The rate at which companies hire workers has fallen to a 7-year low and job-vacancies are back to pre-pandemic level.
It is difficult to reconcile the wage increase with the voluntary quit rate, which measures worker confidence, falling to a nearly three-year low, from 12.7% to 10.8%.
The strong wage data is out of sync with the weakness in consumer spending.
Weakness in temp jobs in the service sector is usually a leading indicator of a cooling labor market.
The increase in part-time jobs is typically a sign of a weakening labor market.
The unemployment rate is now 0.6% above the low for the cycle and up 0.37% over the past 12 months. Historically, an increase of 0.6% from the low has never failed to indicate a recession. According to the Sahm Rule, an increase of 0.5% in unemployment over the prior 12 months is also a recession indicator, and we are right on the cusp of that.
Nearly two-thirds of the job gains were in hospitality, healthcare and education, and government - lower-paying sectors. Keep in mind that while the leisure and hospitality sector has added 1.3 million jobs over the last two years, it is still about 1 million jobs below its long-run trend, thanks to the devastation in this sector during the pandemic.
The payroll number beat by the Establishment survey was about a 4 standard deviation event. That in and of itself gives one pause.
The Household Survey has been consistently negative and found that the number of full-time jobs fell by 625k, putting the number of jobs lost over the past twelve months at 1.2 million. In 60 years, this has never failed to indicate a recession.
According to ZipRecruiter, “The employment-to-population ratio for young workers — which had been steadily increasing earlier in the year — dropped. That decline could signify a more challenging summer hiring season for teens and new grads.”
The bottom line is that historically, the Household Survey has been better at identifying turning points in the business cycle, so I’m paying attention to the flashing warning signs.